
The reporting dashboard that finally makes your ad data make sense.
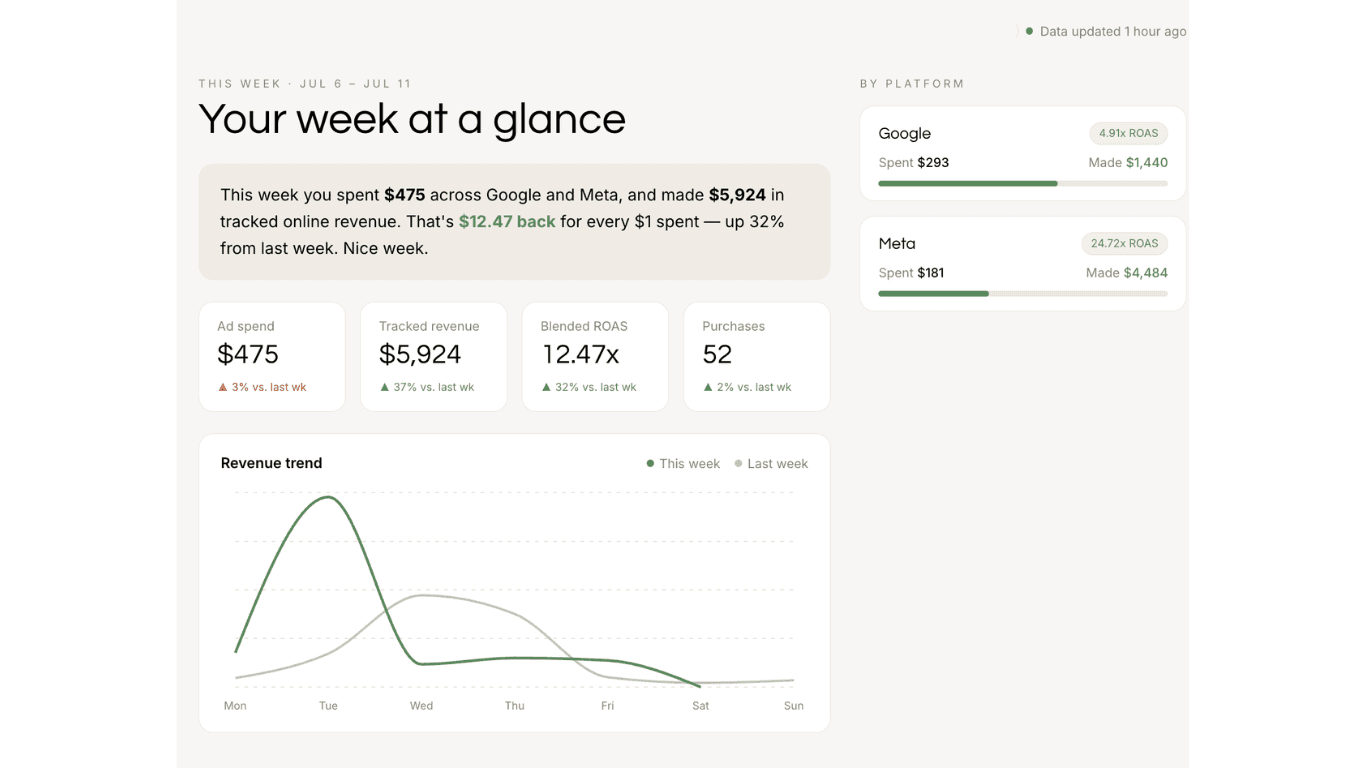
FiddleStats is the reporting dashboard we built for the founders we work with. It pulls real-time data from Meta, Google, TikTok, LinkedIn, and Microsoft every hour, and shows it in plain English so you can read your ad performance in 30 seconds, not 30 minutes. It’s included with every managed package — and now available as a standalone subscription for everyone else.
Get FiddleStats without the agency service.
FiddleStats is now available as a standalone product. Tell us a little about your business and we’ll reach out to schedule your onboarding call — we connect your ad accounts together, and your dashboard is live the same week.
- All 5 ad platforms in one dashboard
- Founding-member pricing, locked for life
- Weekly plain-English recap email
- White-glove onboarding — we handle the setup
Meta and Google are built for media buyers, not founders.
Our clients kept telling us the same thing: they wanted to understand their own ad performance, but every time they opened Ads Manager they closed the tab. So we built the dashboard we wished they had.

There are dozens of columns, confusing filters, and campaign-level views that somehow manage to hide the actual story of what happened.
Meta says one thing, Shopify tells you another, and Google reports a third. It’s hard to know which one to actually trust when you sit down to make a call.
Twelve tabs open, a spreadsheet that keeps crashing, and you’re still not sure how last week actually went by the time your coffee goes cold.
“Wait, what does frequency mean again? And CPA? CVR?” The whole vocabulary was written by growth hackers, for growth hackers, not for the person actually running the business.
Your week in plain English, with suggested next moves.
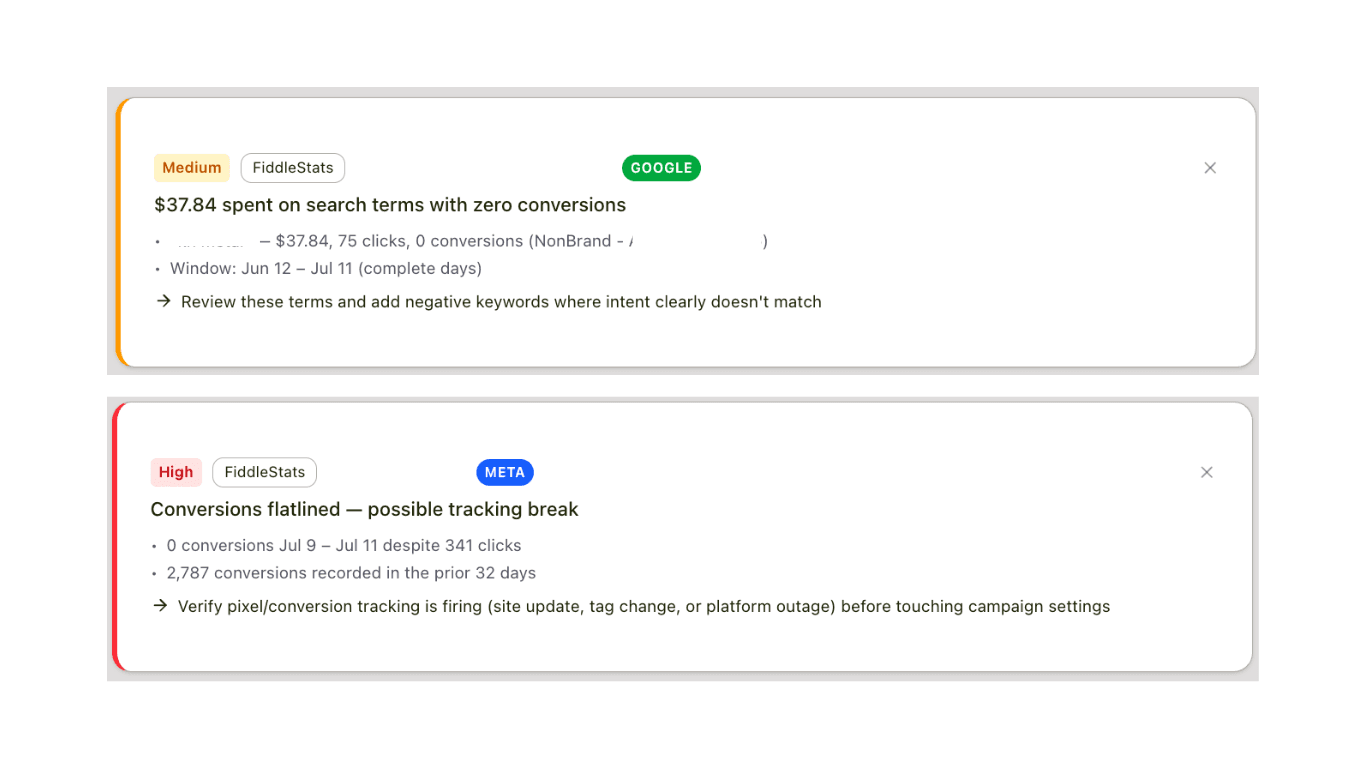
Every Monday morning, FiddleStats emails you a recap of the last 7 days — no jargon, no 40-column tables. And it comes with prioritized suggestions pulled from your own data: search terms quietly eating spend, or a tracking break worth checking before you touch a single campaign setting. Each one tells you what happened and what to do about it.
Meta, Google, TikTok, LinkedIn, Microsoft, all in a single dashboard.
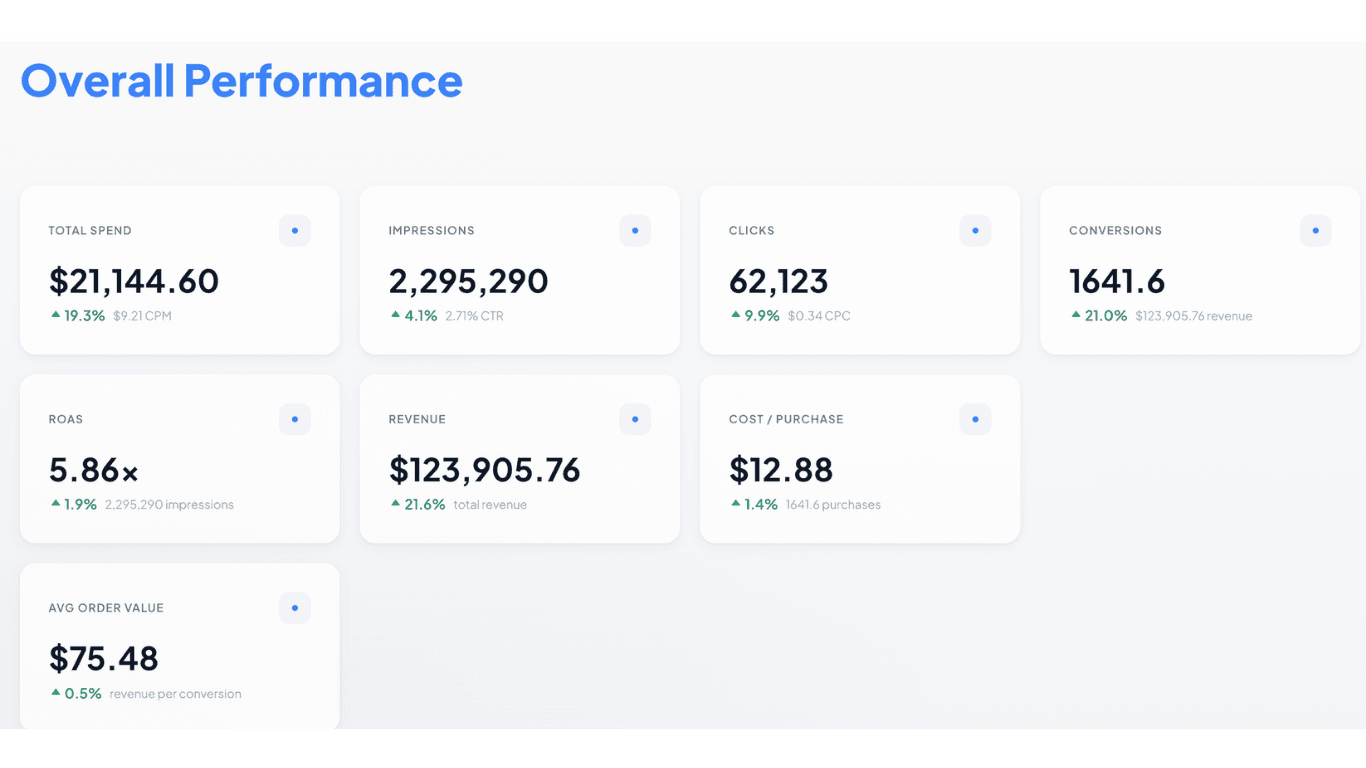
Stop switching tabs. Stop reconciling numbers. FiddleStats pulls data from every ad platform you run and rolls it into one overall performance view: total spend, revenue, ROAS, cost per purchase, all in the same place.
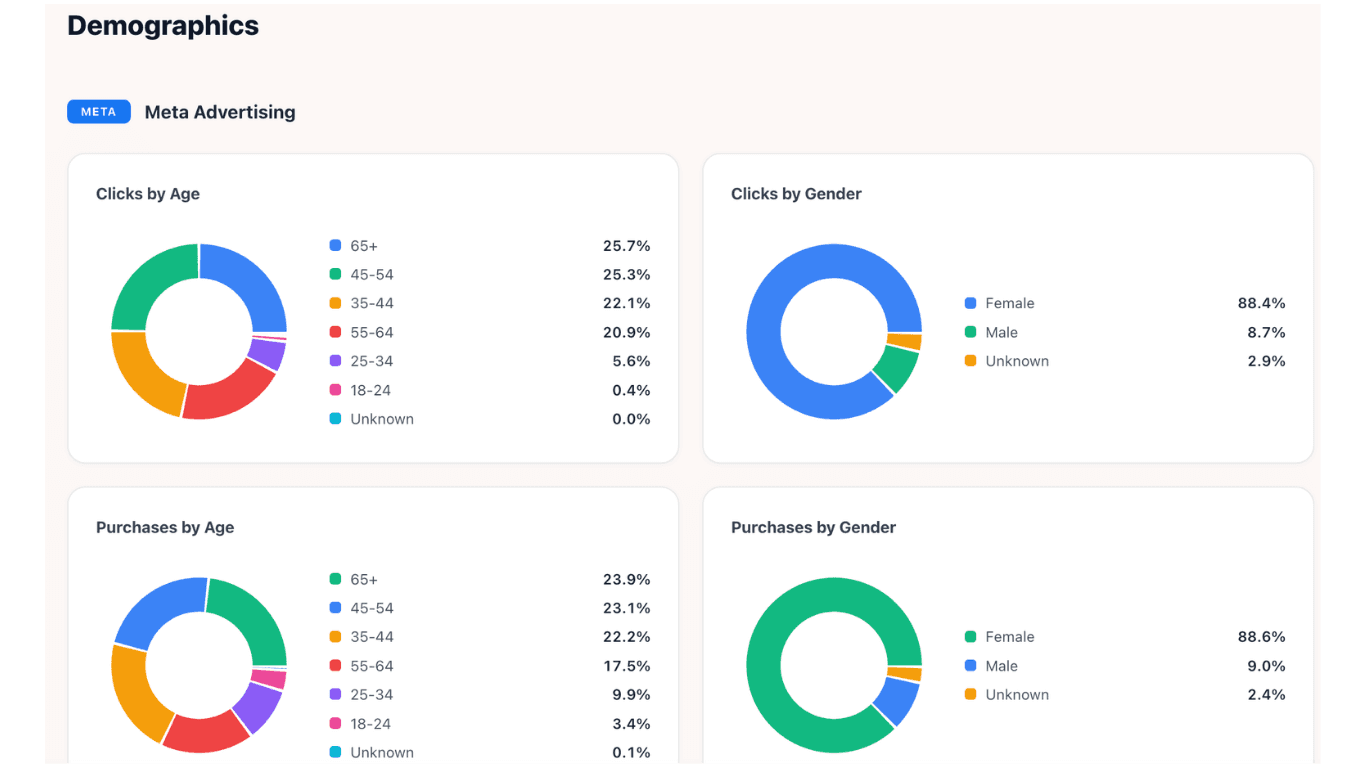
See who clicks, and who actually buys.
Age and gender breakdowns for every platform, with clicks and purchases side by side. So you can tell at a glance whether the people clicking your ads are the same people placing orders, and let that shape your next creative.
Your best ads, ranked, with the reason why.
Top-performing ads across every platform, in one ranked list. Each with spend, revenue, ROAS, and a bar that shows relative impact. So you know exactly what to double down on.
The reaction we hear over and over.
“It is absolutely amazing. It is so easy to navigate and so much less overwhelming than trying to dig through all the data in Meta and Google. Honestly, it feels like a breath of fresh air. A standing ovation from a very relieved shop owner over here for cracking the code and building something that is actually easy to read and understand at a glance.”
“I am obsessed. Like fully obsessed. This is where I am going to live now.”
“I genuinely don’t know how to thank you enough for making something that actually makes sense to my brain instead of me staring at Meta like it is written in another language.”
“Their client dashboard made checking on ad status and understanding performance metrics completely seamless.”
About FiddleStats
Is FiddleStats included with your retainer?
Yes. Every active Fiddle Leaf client gets access, included in the retainer. FiddleStats is also available as a standalone product — sign up here if you want it without the agency service.
How much does FiddleStats cost?
FiddleStats is $199/month. Right now, as a special founders offer, it’s $149/month — and that rate is locked in for as long as you keep your subscription. Sign up to claim it.
How often does the data update?
Every hour, on the hour. FiddleStats pulls from the official Meta, Google, TikTok, LinkedIn, and Microsoft APIs, so what you see matches what’s in the native platforms.
Which platforms does it connect to?
Meta (Facebook & Instagram), Google Ads, TikTok Ads, LinkedIn Ads, and Microsoft Ads. If we ever add a new platform to a client’s stack, we build the integration into FiddleStats.
Can I share access with my team?
Yes, unlimited seats. Add your co-founder, your bookkeeper, your operator, your business coach. Everyone sees the same clean view.
Can I export the data?
Yes. Every view exports to CSV or PDF, and the weekly recap email can be forwarded as-is. Great for board updates or year-end reporting.
What happens if I stop working with Fiddle Leaf?
You can keep FiddleStats. It’s available as a standalone subscription, so if the retainer ends you can stay on the same dashboard, history intact, as a subscriber — sign up here. And if you’d rather just take your records, we’ll export your historical data as CSVs.
Can I get FiddleStats without working with you?
Yes. Sign up with a few details about your business and we’ll reach out to schedule your onboarding call. Founding-member pricing is locked for life for early subscribers.
The dashboard is the second-favorite part of working with us.
(The first is the results.) Get FiddleStats standalone today — or if you’d rather hear how we can grow your business with paid ads, book a strategy call. Every managed package includes FiddleStats.